Costs
Fixed Costs are costs that do not vary with output produced or sold in the short run. They are incurred even when the output is 0 and will remain the same in the short run. In the long-run they may change. Also known as overhead costs.
E.g.: rent, even if production has not started, the firm still has to pay the rent.
Variable Costs are costs that directly vary with the output produced or sold. E.g.: material costs and wage rates that are only paid according to the output produced.
TOTAL COST = TOTAL FIXED COSTS + TOTAL VARIABLE COSTS
TOTAL COST = AVERAGE COST * OUTPUT
AVERAGE COST (unit cost) = TOTAL COST/ TOTAL OUTPUT
A business can use these cost data to make different decisions. Some examples are: setting prices (if the average cost of one unit is $3, then the price would be set at $4 to make a profit of $1 on each unit), deciding whether to stop production (if the total cost exceeds the total revenue, a loss is being made, and so the production might be stopped), deciding on the best location (locations with the cheaper costs will be chosen) etc.
Scale of production
As output increases, a firm’s average cost decreases.
Economies of scale are the factors that lead to a reduction in average costs as a business increases in size. The five economies of scale are:
- Purchasing economies: For large output, a large amount of components have to be bought. This will give them some bulk-buying discounts that reduce costs
- Marketing economies: Larger businesses will be able to afford its own vehicles to distribute goods and advertise on paper and TV. They can cut down on marketing labour costs. The advertising rates costs also do not rise as much as the size of the advertisement ordered by the business. Average costs will thus reduce.
- Financial economies: Bank managers will be more willing to lend money to large businesses as they are more likely to be able to pay off the loan than small businesses. Thus they will be charged a low rate of interest on their borrowings, reducing average costs.
- Managerial economies: Large businesses may be able to afford to hire specialist managers who are very efficient and can reduce the business’ costs.
- Technical economies: Large businesses can afford to buy large machinery such as a flow production line that can produce a large output and reduce average costs.
Diseconomies of scale are the factors that lead to an increase the average costs of a business as it grows beyond a certain size. They are:
- Poor communication: as a business grows large, more departments and managers and employees will be added and communication can get difficult. Messages may be inaccurate and slow to receive, leading to lower efficiency and higher average costs in the business.
- Low morale: when there are lots of workers in the business and they have non-contact with their senior managers, the workers may feel unimportant and not valued by management. This would lead to inefficiency and higher average costs.
- Slow decision-making: As a business grows larger, its chain of command will get longer. Communication will get very slow and so any decision-making will also take time, since all employees and departments may need to be consulted with.
Businesses are now dividing themselves into small units that can control themselves and communicate more effectively, to avoid any diseconomies from arising.
Break-even
Break-even level of output is the output that needs to be produced and sold in order to start making a profit. So, the break-even output is the output at which total revenue equals total costs (neither a profit nor loss is made, all costs are covered).
A break-even chart can be drawn, that shows the costs and revenues of a business across different levels of output and the output needed to break even.
Example:
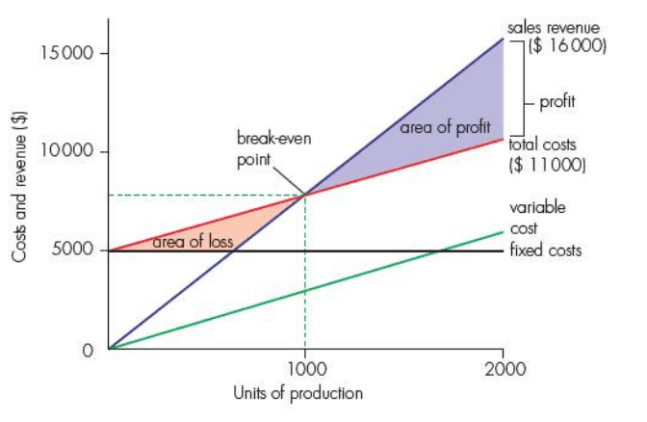
In the chart below, costs and revenues are being calculated over the output of 2000 units.
The fixed costs is 5000 across all output (since it is fixed!).
The variable cost is $3 per unit so will be $0 at output is 0 and $6000 at output 2000- so you just draw a straight line from $0 to $6000.
The total costs will then start from the point where fixed cost starts and be parallel to the variable costs (since T.C.= F.C.+V.C. You can manually calculate the total cost at output 2000: ($6000+$5000=$11000).
The price per unit is $8 so the total revenue is $16000 at output 2000.
Now the break-even point can be calculated at the point where total revenue and total cost equals– at an output of 1000. (In order to find the sales revenue at output 1000, just do $8*1000= $8000. The business needs to make $8000 in sales revenue to start making a profit).
Advantages of break-even charts:
- Managers can look at the graph to find out the profit or loss at each level of output
- Managers can change the costs and revenues and redraw the graph to see how that would affect profit and loss, for example, if the selling price is increased or variable cost is reduced.
- The break-even chart can also help calculate the safety margin- the amount by which sales exceed break-even point. In the above graph, if the business decided to sell 2000 units, their margin of safety would be 1000 units. In sales terms, the margin of safety would be 1000*8 = $8000. They are $8000 safe from making a loss.
Margin of Safety (units) = Units being produced and sold – Break-even output
Limitations of break-even charts:
- They are constructed assuming that all units being produced are sold. In practice, there are always inventory of finished goods. Not everything produced is sold off.
- Fixed costs may not always be fixed if the scale of production changes. If more output is to be produced, an additional factory or machinery may be needed that increases fixed costs.
- Break-even charts assume that costs can always be drawn using straight lines. Costs may increase or decrease due to various reasons. If more output is produced, workers may be given an overtime wage that increases the variable cost per unit and cause the variable cost line to steep upwards.
Break-even can also be calculated without drawing a chart. A formula can be used:
Break-even level of production =Total fixed costs/ Contribution per unit
Contribution = Selling price – Variable cost per unit (this is the value added/contributed to the product when sold)
In the above example, the contribution is $8 -$3 =$5, so the break-even level is:
$5000/$5 = 1000 units!
Notes submitted by Lintha
Click here to go to the next topic
Click here to go back to the previous topic
Click here to go back to the Business Studies menu

Haaa good notes
Ohhh and hi Corcky
LikeLike
These notes are helpful. I appreciate you making this website and understanding the concepts!
LikeLiked by 2 people
You’re welcome! ☺️
LikeLike
Typo at third bullet point of (Advantages of break-even charts), its Te instead of “The”
LikeLike
Corrected! Thank you!
LikeLike
Thankkkkk you so much this note are really helpful
LikeLiked by 1 person
thank you very much i was simply able to understand every thing clearly an ddo a presentation for my class and now i have an A* thank you once again
LikeLiked by 1 person
Congrats!! So happy that we could help!
LikeLike