- Define speed and calculate the average speed from (total distance)/(total time)
The definition of speed is the distance travelled per unit time.
Which is why the equation for speed is speed = (total distance)/(total time)
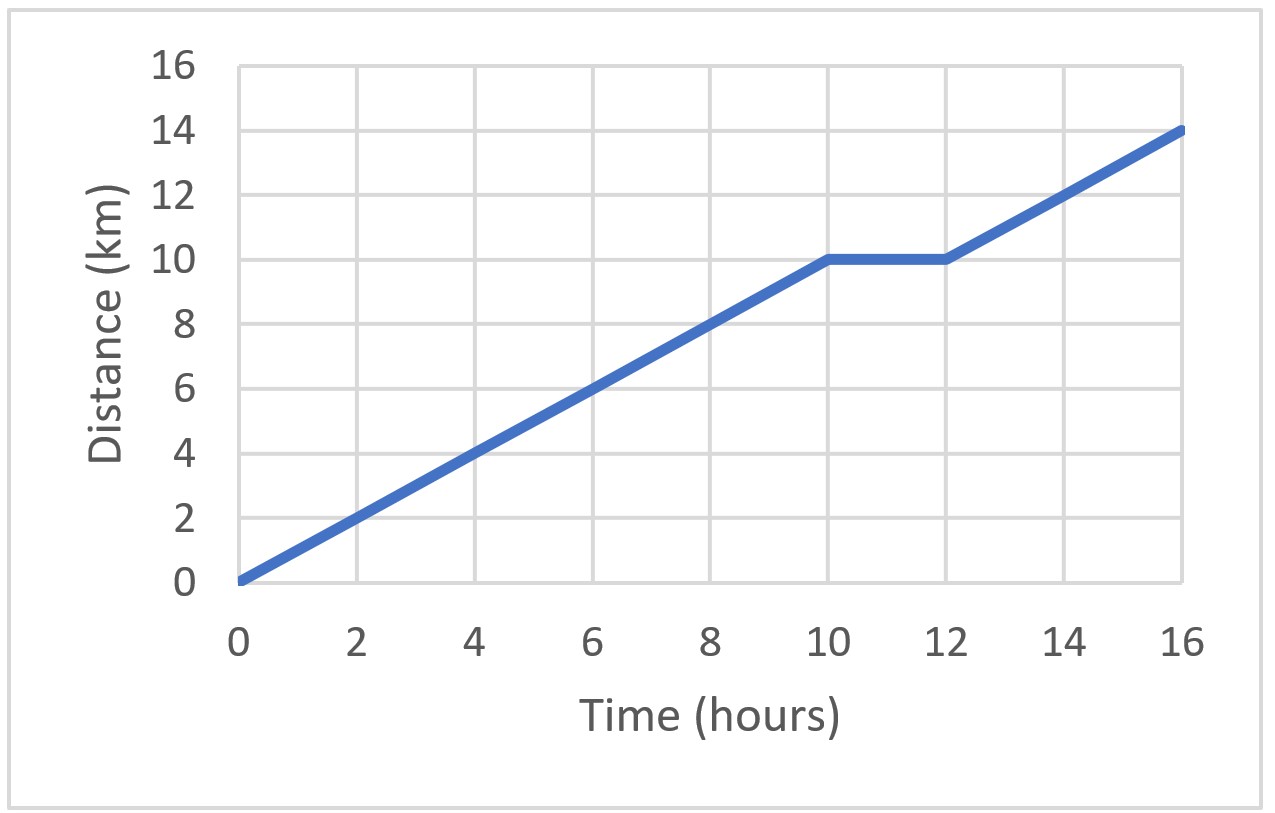 For example, if you look at the distance-time graph to the left, you can see a straight line from time = 0 hours until time = 10 hours.
That means the speed over this time interval is constant.
Now let’s calculate the speed of the object during this time interval.
In this case, over the course of 10 hours, the object travels 10 km. So, since speed = distance/time, the speed of the object is (10 km)/(10 hours) = 1 km/hr
If you want to calculate the average speed of an object over a length of time, and that object travels at various speeds in that time interval, then take the total distance it has travelled, and the total time it took to travel that distance, and calculate total distance divided by total time.
So, in this case, that is:
speed= (total distance)/(total time)= 14/16=0.875 km/hr
2. Distinguish between speed and velocity
Both speed and velocity are measures of how fast an object is travelling.
Speed defines the ‘magnitude’ of the object’s speed – in other words, how fast it’s going.
Velocity defines the ‘magnitude’ of the speed of the object as well as the direction it is travelling. So if an object maintains the same speed, but changes direction, its velocity will change.
Since speed does not define the object’s direction, only how fast it’s going, speed is a ‘scalar’ quantity. A scalar quantity is a quantity that defines the ‘magnitude’ of the measurement we’re taking of the object (e.g. If an object has a mass of 23 kg, the magnitude of its mass is 23 kg). However, a scalar quantity does not tell us the direction of this measure (mass has no direction).
Since velocity defines both the magnitude of the object’s speed and its direction, it is a ‘vector’ quantity. A vector quantity is a quantity that defines the ‘magnitude’ of the measurement of the object (e.g. a weight of 11 N has a magnitude of 11 N), as well as the direction that this measurement goes in (weight is the force exerted on something by gravity – this force has a direction. On Earth, gravity always pulls objects towards the centre of Earth, so the direction of weight will always be down).
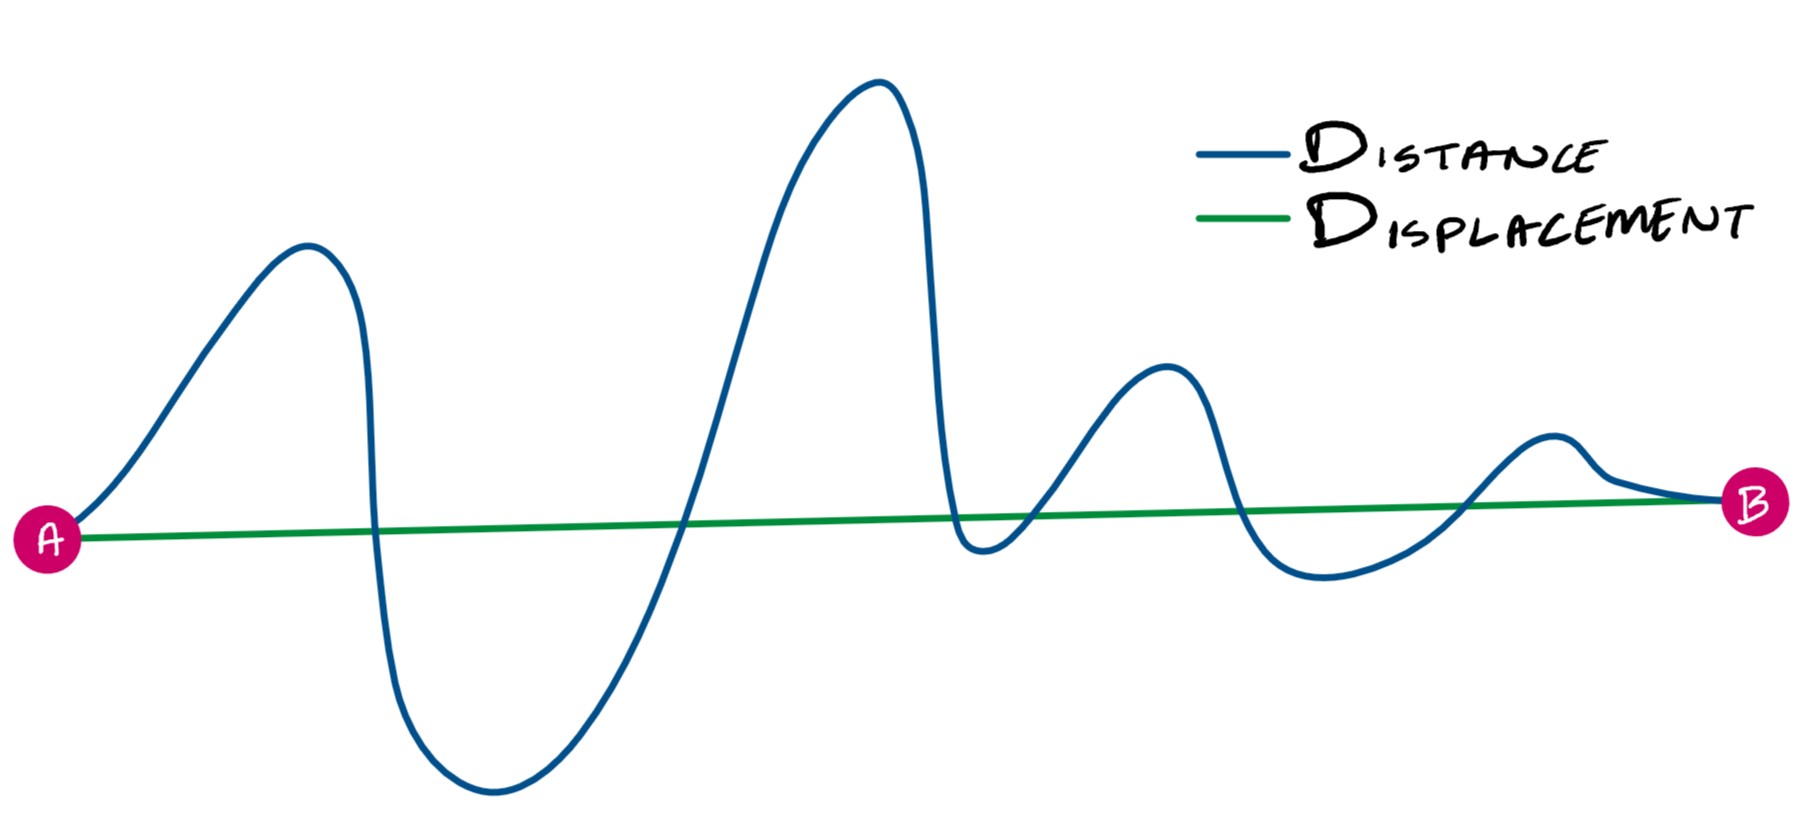
Note: speed is calculated using the equation distance/time,
And velocity is calculated using the equation displacement/time
This difference is important because while distance is a scalar quantity (it measures how far something has travelled without taking into account the direction it has travelled), displacement is a vector quantity (it defines the overall direction that the object has travelled in, and the straight line distance between its starting and ending point).
3. Define and calculate acceleration using (change of velocity)/(time taken)
Acceleration is the change of velocity of an object per unit time.
To calculate acceleration, first calculate the change in velocity during the time interval you are looking at. To do this, jot down the final velocity of the object and its initial velocity. Then, find the difference between the two. This will give you the change in velocity.
After this, measure the time taken (final time minus initial time), and input these values in the equation above.
Here’s a worked example:
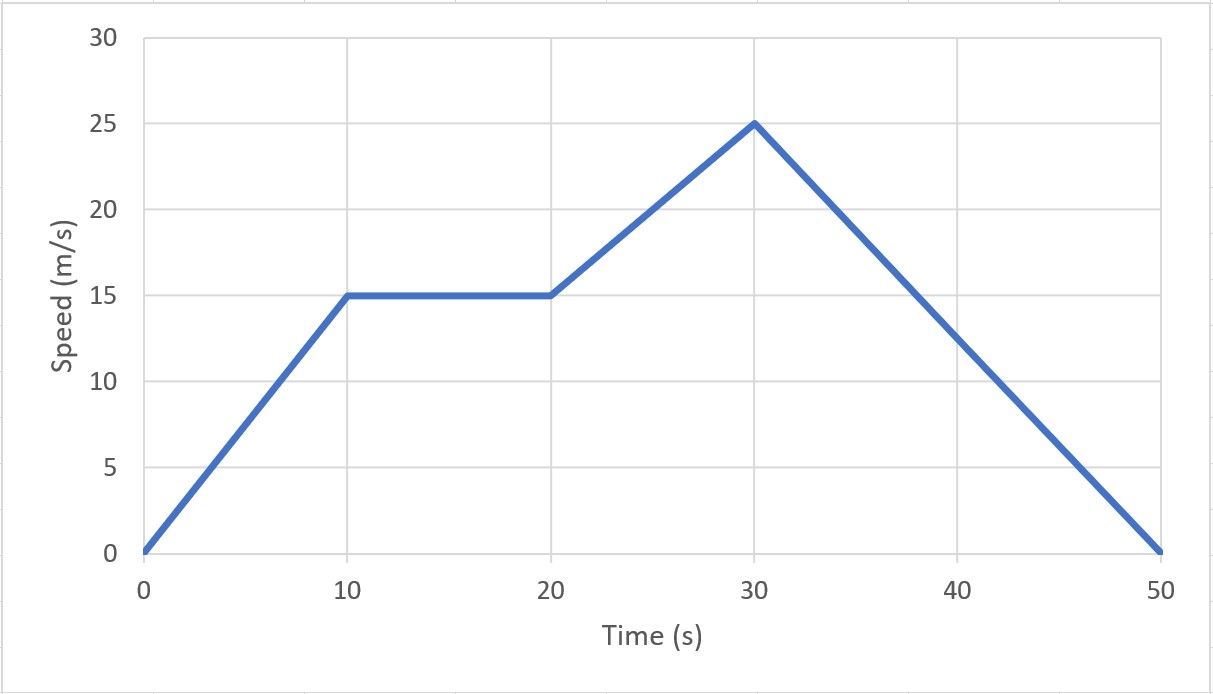
We’re going to calculate the object’s acceleration during the interval t = 20 s to t = 30 s.
First, we need to calculate the change in velocity:
That is the final speed – initial speed = 25 – 15 = 10 m/s
Next, we need to calculate the time taken:
Final time – initial time = 30 – 20 = 10 s
Now, we can calculate the acceleration:
(change of velocity)/(time taken) = (10 m/s)/(10 s) = 1 m/s^2
Note: always check your units.
4. Plot and interpret a speed-time graph and a distance-time graph
Plotting a graph is simple, and you should already know how to do this. If you don’t, let me know in the comments below or by emailing me, and I’ll update the notes accordingly!
Remember, time is always on the x-axis for graphs of motion.
If it’s a speed-time graph, speed will be on the y-axis; if it’s a distance-time graph, the distance will be on the y-axis.
First, let’s look at distance-time graphs:

In a distance-time graph, you can tell how far an object has travelled away from the starting point at any time – you just have the read the distance off of the graph at the relevant time.
Remember, the further the object travels from the starting point, the greater its distance.
In the first graph, the object continues to travel further and further from the starting point.
In the second graph, after 10 hours, the distance starts to decrease – this means the object is travelling back towards the starting point.
You can also calculate the object’s speed at any point by calculating the gradient of the line.
When the line is flat and horizontal, the gradient is 0, so the object’s speed is 0 – the object is at rest.
When the line is straight but slanting, the gradient is at a non-0 value, and the gradient remains the same throughout the whole straight line. That means the object is travelling at a constant speed (the gradient doesn’t change), and the object is not at rest (the gradient isn’t 0).
Now, let’s look at speed-time graphs:
From a speed-time graph, you can tell the speed of the object at any time, by reading the speed off of the graph.
Remember, when speed = 0 (when the line touches the x-axis), the object is at rest.
You can also calculate the distance the object has travelled by calculating the area under the line.
Here’s a worked example using the above graph:
Q. calculate the distance travelled by the object in the first 10 s.
A. So we need to calculate the area under the line in the first 10s.
This part of the line forms a triangle. The formula for the area of a triangle is ½ x height x base.
The height of the triangle can be read off the speed axis: 15 m/s.
The base of the triangle can be read off the time axis: 10 s.
The area of the triangle is ½ x 15 x 10 = 75.
So in the first 10 s, the object has travelled 75 m.
Q. calculate the total distance travelled by the object.
A. To do this, we have to break down the space under the line into more straightforward shapes – this will make it easier to calculate the area under the graph.
I broke down the area under the graph into triangles and rectangles:
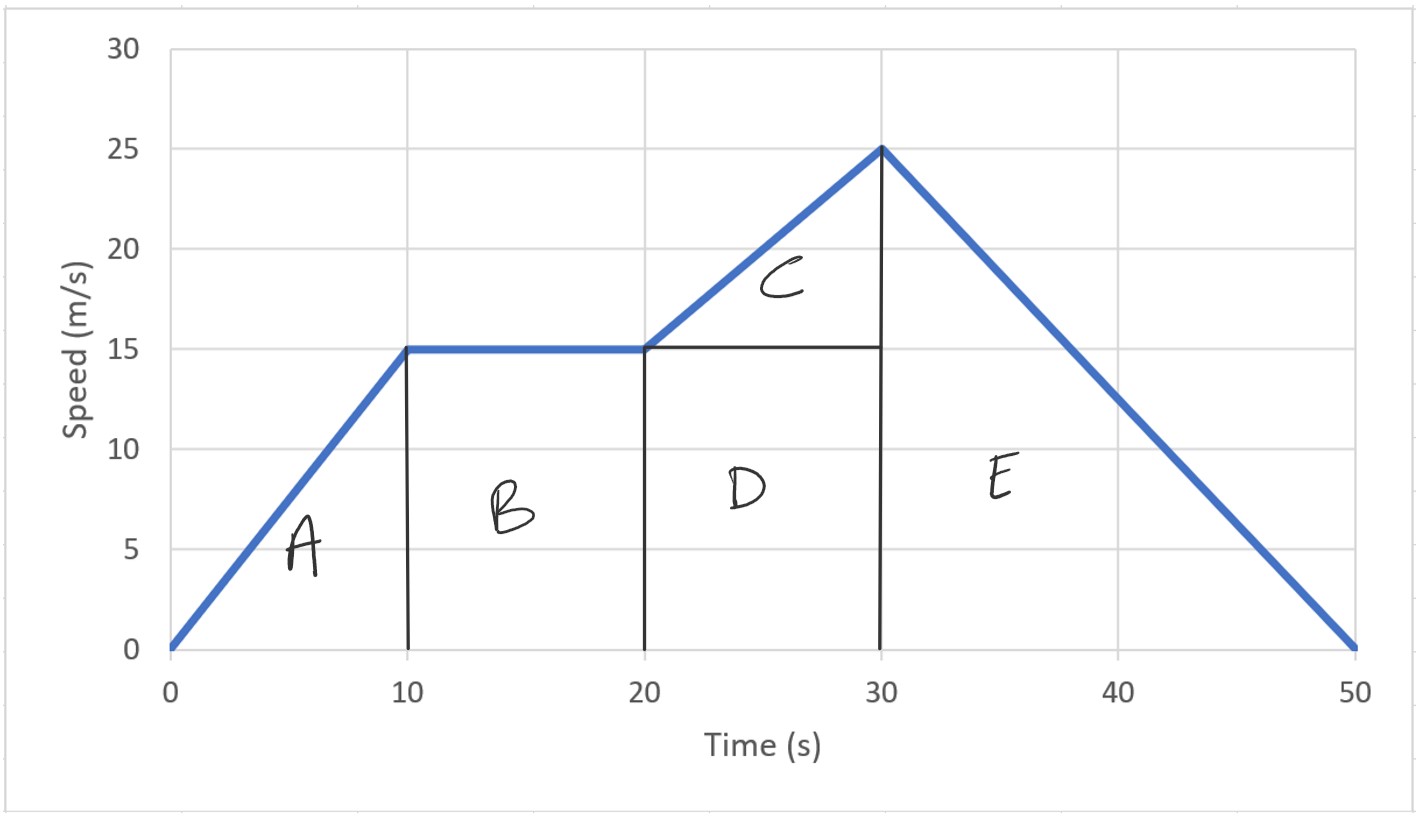
Now, we have to calculate the area of each of the shapes:
A: ½ x 15 x 10 = 75 m
B: 15 x (20 – 10) = 15 x 10 = 150 m
C: ½ x (25 – 15) x (30 – 20) = ½ x 10 x 10 = 50 m
D: 15 x (30 – 20) = 15 x 10 = 150 m
E: ½ x 25 x (50 – 30) = ½ x 25 x 20 = 250 m
Next, we add up each of the areas to get the total area:
75 + 150 + 50 + 150 + 250 = 675 m.
So the object travelled a total distance of 675 m.
From a speed-time graph, you can also calculate the acceleration of the object at any time by calculating the gradient of the line at that time. So if the line is flat and horizontal, speed is constant, and acceleration is 0 (because the gradient is 0).
If the line is straight at any point, the acceleration is constant. If the line is sloping upwards, the object is accelerating (its speed is increasing) and if the line is sloping down, the object is decelerating (its speed is decreasing).
5. Calculate acceleration from the gradient of a speed-time graph
Like I mentioned earlier, you can calculate acceleration by calculating the gradient of a speed-time graph.
Here’s a worked example:
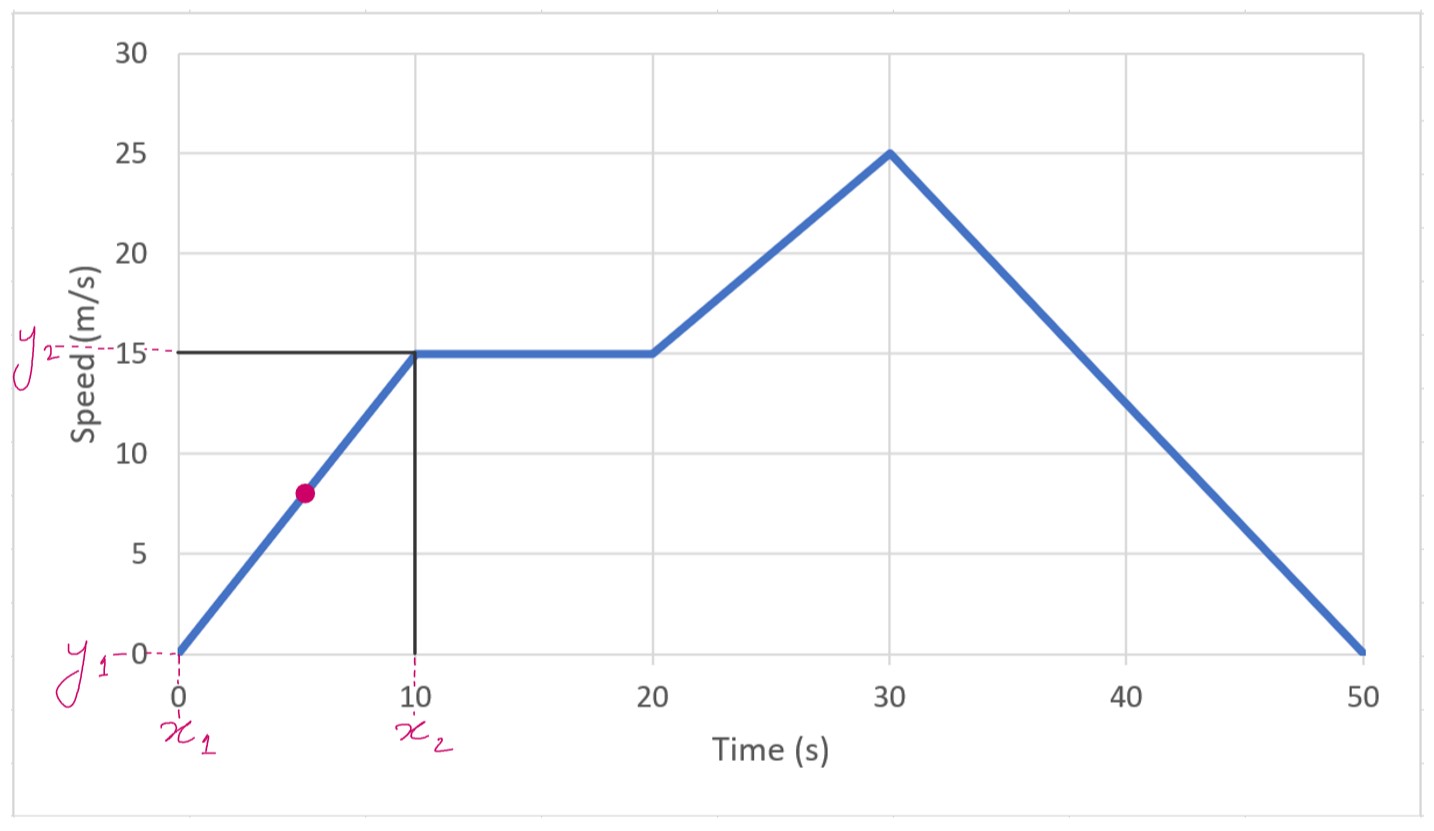
Q. Calculate the acceleration of the object at t = 5 s.
A. I’ve marked the point on the graph at 5s.
Since the point lies on a straight line, we calculate the gradient of the straight line. If the point was lying on a curved line, you would draw a tangent of the curve at the point and calculate the gradient of the tangent.
So for this question, we can calculate the gradient of the straight line that the point lies on:

y1 and y2 are the line’s y-axis values at the beginning and end of the line, respectively; x1 and x2 are the line’s x-axis values at the beginning and end of the line.
So,

6. Recognise from the shape of a speed-time graph when a body is:
- At rest
- Moving with constant speed
- Moving with changing speed
When the line of a speed-time graph touches the x-axis, the object is at rest because its speed is at 0 m/s.
When the line of a speed-time graph is horizontal, the object is travelling at a constant speed.
When the line of a speed-time graph is not horizontal (it is sloped), the object is travelling with changing speed.
7. Recognise linear motion for which the acceleration is constant and calculate the acceleration
Linear motion is motion across a straight line. On a speed-time graph, you can calculate the acceleration by calculating the gradient of the line. Acceleration on a speed-time graph is constant when the line is straight.
8. Calculate the area under a speed-time graph to work out the distance travelled for motion with constant acceleration
This has already been done under learning objective number 4.
9. Recognise motion for which the acceleration is not constant
Because acceleration is defined as the change in velocity over time, and velocity is a vector quantity, acceleration is also a vector quantity.
This means, even if the magnitude of the acceleration of an object remains the same, but it changes direction, its acceleration changes. E.g. when turning corners, or when you throw an object up and it eventually stops going up and starts to fall down, etc.
Acceleration can also change if the body continues moving in the same direction, but the rate of change of the body’s velocity changes.
e.g. if an object falls close to Earth, in a gas and air free environment, it will fall at a constant acceleration called ‘g’. ‘g’ is the acceleration of free fall, and is approximately 9.81 m/s^2.
However, if the same object falls towards the ground in an environment that contains air, it will first accelerate towards the ground at 9.81 m/s^2. However, the air will start pushing back against the object, creating air resistance or drag. This causes the acceleration to fall until the object stops accelerating and falls towards the Earth at a constant speed. This constant speed is called its terminal velocity and is the velocity at which the pull on the object by gravity is equal to the push against the object by air resistance.
On a speed-time graph, if the line is curved or bent, then the acceleration changes there.
10. Demonstrate an understanding that acceleration and deceleration are related to changing speed including qualitative analysis of the gradient of a speed-time graph
Acceleration is the rate of change of velocity, and thus, is related to changing speed.
Deceleration is any acceleration with a negative magnitude (e.g., -9 m/s^2), and occurs when an object is slowing down (its final speed is less than its initial speed).
When a line slopes upwards on a speed-time graph (it has a positive gradient), the object is accelerating.
When a line slopes downwards on a speed-time graph (it has a negative gradient), the object is decelerating.
The steeper the slope of the line, the greater the magnitude of the acceleration/ deceleration.
11. State that the acceleration of free fall g for a body near to Earth is constant
The acceleration of free fall (g) for a body near to Earth is constant.
This means that generally, near Earth, objects will fall at a constant acceleration of approximately 9.81 m/s^2.
Notes submitted by Sarah.
Click here to go to the next topic.
Click here to go to the previous topic.
Click here to go back to the Science menu.
